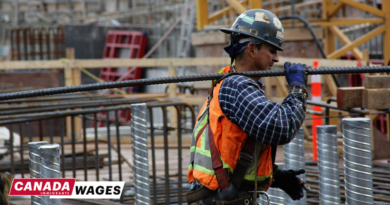
Welder Salary in Canada | Breakdown by Province
In Canada, the median salary for welders is $30/hr.

Welders in Canada: job prospects, employment requirements, licensing.
Welders in Canada, classified under NOC 72106 as welders and related machine operators, join and repair metal and other materials using various welding techniques such as arc, gas, MIG, TIG, and robotic welding processes in manufacturing, construction, shipbuilding, and repair settings. Approximately 60,000 to 70,000 people work in this occupation nationally. Job prospects show a moderate risk of labour shortage nationally through 2033, with about 25,600 projected job openings roughly matching the expected 25,000 job seekers, driven primarily by replacement demand from retirements and needs in key industries.
Median hourly wages stand at about 30.00 Canadian dollars nationally, with typical ranges from 22.00 to 47.00 dollars per hour depending on experience, location, industry, certification level, and whether the role involves specialized or pressure welding. Most positions require completion of a three- to four-year apprenticeship program or a college welding program along with provincial or territorial certification (Red Seal endorsed), and work conditions generally involve full-time shop or field environments that may include overtime, physically demanding tasks, prolonged standing, exposure to heat, fumes, noise, bright light, and strict adherence to safety protocols and personal protective equipment.
Licensing
Requirements vary from one province or territory to another. For a regulated occupation, you must have a licence or certificate, or be registered with the regulatory body before you can legally start practising your trade or profession.
Compare the average Plumber salary by province.
Welder Salary by Province
| WELDER (NOC 72106) | |||
| 2025 | Wages/hr | ||
| Community/Area | Low | Median | High |
| Canada | 22.00 | 30.00 | 47.00 |
| Newfoundland and Labrador | 23.46 | 38.41 | 54.00 |
| Prince Edward Island | 20.00 | 25.00 | 32.50 |
| Nova Scotia | 21.00 | 29.00 | 43.00 |
| New Brunswick | 22.00 | 28.00 | 46.00 |
| Quebec | 22.00 | 28.00 | 35.38 |
| Ontario | 21.00 | 28.00 | 41.28 |
| Manitoba | 21.00 | 27.00 | 40.16 |
| Saskatchewan | 22.00 | 32.00 | 46.00 |
| Alberta | 25.00 | 38.00 | 52.18 |
| British Columbia | 23.25 | 35.00 | 51.87 |
| Yukon Territory | 30.96 | 37.47 | 49.71 |
| Northwest Territories | 22.48 | 48.29 | 57.68 |
| Nunavut | N/A | N/A | N/A |
| Source: Job Bank. 2026 | |||
In 2023, welders reported higher wages in Newfoundland and Labrador.
| WELDER (NOC 72106) | |||
| 2023 | Wages ($/hour) | ||
| Province/Territory | Low | Median | High |
| Canada | 20 | 28 | 42.5 |
| Newfoundland and Labrador | 26.15 | 36.47 | 54 |
| Prince Edward Island | 16 | 22 | 30 |
| Nova Scotia | 19 | 30 | 41 |
| New Brunswick | 19 | 26 | 42.63 |
| Quebec | 20.6 | 26 | 36.8 |
| Ontario | 19 | 25.85 | 38.5 |
| Manitoba | 18.94 | 24.72 | 34.65 |
| Saskatchewan | 20 | 30 | 39 |
| Alberta | 22.97 | 36 | 46 |
| British Columbia | 21 | 32 | 48 |
| Yukon Territory | 28.39 | 34.46 | 45.2 |
| Northwest Territories | N/A | N/A | N/A |
| Nunavut | N/A | N/A | N/A |
| Source: Job Bank. 2024 | |||
In 2021, welders reported higher wages in Newfoundland and Labrador
| WELDERS AND RELATED MACHINE OPERATORS (NOC 7237) | |||
| Community/Area | Wages ($/hour) | ||
| Low | Median | High | |
| Canada | 18 | 25.5 | 41.1 |
| Newfoundland and Labrador | 22 | 32.5 | 47.74 |
| Prince Edward Island | 16 | 21.75 | 28 |
| Nova Scotia | 21 | 29.29 | 36.03 |
| New Brunswick | 16 | 22 | 38 |
| Quebec | 17.5 | 23.5 | 38 |
| Ontario | 18 | 24 | 35.58 |
| Manitoba | 17.24 | 25 | 37 |
| Saskatchewan | 21 | 29 | 43.27 |
| Alberta | 21 | 34 | 46 |
| British Columbia | 22 | 30 | 44.97 |
| Yukon Territory | N/A | N/A | N/A |
| Northwest Territories | N/A | N/A | N/A |
| Nunavut | N/A | N/A | N/A |
| Source: Job Bank. November 2021 | |||
In 2019, welders reported higher wages in Alberta.
| WELDERS AND RELATED MACHINE OPERATORS (NOC 7237) | |||
| 2019 | Wages ($/hour) | ||
| Province/Territory | Low | Median | High |
| Canada | 16.5 | 24.75 | 40 |
| Newfoundland and Labrador | 17.5 | 32.97 | 44 |
| Prince Edward Island | 14 | 20.5 | 28 |
| Nova Scotia | 16 | 24.38 | 34 |
| New Brunswick | 15 | 22.8 | 38.5 |
| Quebec | 16.6 | 21 | 30 |
| Ontario | 15 | 23 | 33.43 |
| Manitoba | 16 | 22 | 31.86 |
| Saskatchewan | 18 | 28 | 42.36 |
| Alberta | 20 | 33.04 | 45.79 |
| British Columbia | 18 | 28 | 40 |
| Yukon Territory | N/A | N/A | N/A |
| Northwest Territories | N/A | N/A | N/A |
| Nunavut | N/A | N/A | N/A |
| Source: Job Bank. May 2019 | |||
In 2017, welders reported higher wages in the Northwest Territories
| WELDERS AND RELATED MACHINE OPERATORS (NOC 7237-B) | |||
| 2017 | Wages ($/hr) | ||
| Province/Territory | Low | Median | High |
| Canada | 16 | 24.02 | 39.05 |
| Northwest Territories | 12.5 | 34.74 | 52.36 |
| Alberta | 20 | 33.79 | 46 |
| Newfoundland and Labrador | 17.5 | 32 | 43.44 |
| Saskatchewan | 18 | 28 | 42 |
| British Columbia | 16 | 28.5 | 40.76 |
| New Brunswick | 15 | 21 | 38.5 |
| Nova Scotia | 15 | 21 | 35 |
| Ontario | 15 | 22 | 34 |
| Québec | 15 | 21 | 29.85 |
| Manitoba | 15 | 20.4 | 29 |
| Prince Edward Island | 14.42 | 20 | 28 |
| Nunavut | N/A | N/A | N/A |
| Yukon | N/A | N/A | N/A |
| Source: Job Bank. September 2017* | |||
*Wages are reviewed and updated on the Job Bank Web site on an annual basis.
In 2016, a welder median wage was $23.17/hr.
The salary range for welders varies by province. In 2016, for example, plumbers had the highest salaries in the Northwest Territories.
| WELDERS AND RELATED MACHINE OPERATORS (NOC 7237-B) | |||
| 2016 |
Wages ($/hr) | ||
| Province/Territory | Low | Median | High |
| Canada | 15 | 23.17 | 39 |
| Northwest Territories | 12.5 | 34.74 | 52.36 |
| Alberta | 20.5 | 32 | 43 |
| Saskatchewan | 18.25 | 26.5 | 42 |
| Newfoundland and Labrador | 20 | 32 | 41 |
| British Columbia | 15 | 29 | 39.83 |
| Nova Scotia | 14 | 21 | 36 |
| Ontario | 15 | 21.47 | 33 |
| New Brunswick | 12.5 | 19 | 32.75 |
| Québec | 14 | 20 | 28.5 |
| Manitoba | 15.5 | 20 | 28.15 |
| Prince Edward Island | 12 | 19.2 | 28 |
| Nunavut | N/A | N/A | N/A |
| Yukon | N/A | N/A | N/A |
| Source: Job Bank. November 2016* | |||
*Wages are reviewed and updated on the Job Bank Web site on an annual basis.
WELDER SALARY IN CANADA 2019
WELDER SALARY IN CANADA 2018
WELDER SALARY IN CANADA 2017