Quebec Immigration by Country
From 2000 to 2015, 3,993,035 permanent residents landed in Canada.
During this period, Quebec was the province of choice of 18.3% of Canada’s immigrants.
| Annual immigration to Quebec* | ||
| Total | Percentage** | |
| 2000 | 32,500 | 14.3% |
| 2001 | 37,600 | 15.0% |
| 2002 | 37,600 | 16.4% |
| 2003 | 39,560 | 17.9% |
| 2004 | 44,250 | 18.8% |
| 2005 | 43,315 | 16.5% |
| 2006 | 44,680 | 17.8% |
| 2007 | 45,205 | 19.1% |
| 2008 | 45,200 | 18.3% |
| 2009 | 49,500 | 19.6% |
| 2010 | 53,995 | 19.2% |
| 2011 | 51,715 | 20.8% |
| 2012 | 55,020 | 21.3% |
| 2013 | 51,980 | 20.1% |
| 2014 | 50,230 | 19.3% |
| 2015 | 48,960 | 18.0% |
| Total | 731,310 | 18.3% |
| *Intended Destination | ||
| **Quebec’s share of Canada’s immigration | ||
| Source: Government of Canada | ||
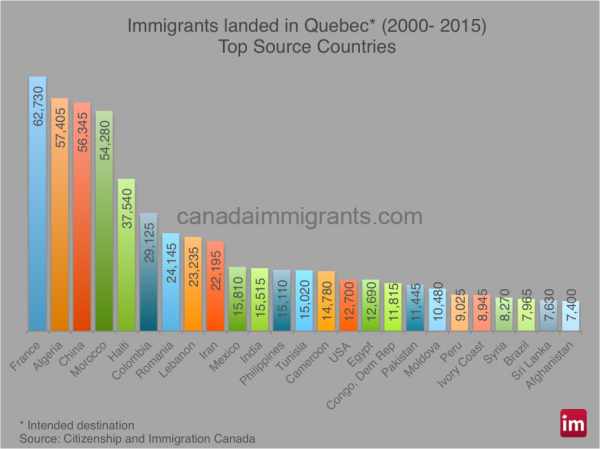
During this period, immigrants to Quebec came from more than 170 countries2.
The top ten source countries of newcomers to Quebec were France (8.6%), Algeria (7.8%), China (7.7%), Morocco (7.4%), Haiti (5.1%), Colombia (4%), Romania (3.3%), Lebanon (3.2%), Iran (3%) and Mexico (2.2%).
In 2011, according to the National Household Survey, 974,590 foreign-born people3 resided in Quebec.
2 Country of Citizenship
3 People born outside Canada
Related articles:

