New Brunswick Immigration by Country
From 2000 to 2015, 3,993,035 permanent residents landed in Canada.
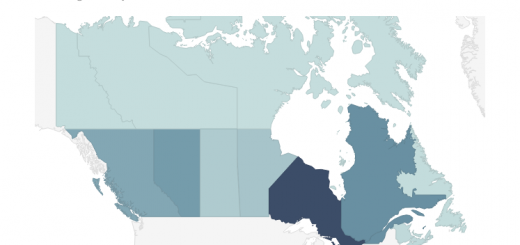
During this period, New Brunswick was the province of choice of 0.64% of Canada’s immigrants.
| Annual immigration to New Brunswick* | ||
| Total | Percentage** | |
| 2000 | 760 | 0.3% |
| 2001 | 800 | 0.3% |
| 2002 | 705 | 0.3% |
| 2003 | 670 | 0.3% |
| 2004 | 795 | 0.3% |
| 2005 | 1,090 | 0.4% |
| 2006 | 1,645 | 0.7% |
| 2007 | 1,645 | 0.7% |
| 2008 | 1,855 | 0.8% |
| 2009 | 1,915 | 0.8% |
| 2010 | 2,125 | 0.8% |
| 2011 | 1,970 | 0.8% |
| 2012 | 2,210 | 0.9% |
| 2013 | 2,020 | 0.8% |
| 2014 | 2,835 | 1.1% |
| 2015 | 2,580 | 0.9% |
| Total | 25,620 | 0.6% |
| *Intended Destination | ||
| **New Brunswick’s share of Canada’s immigration | ||
| Source: Government of Canada | ||
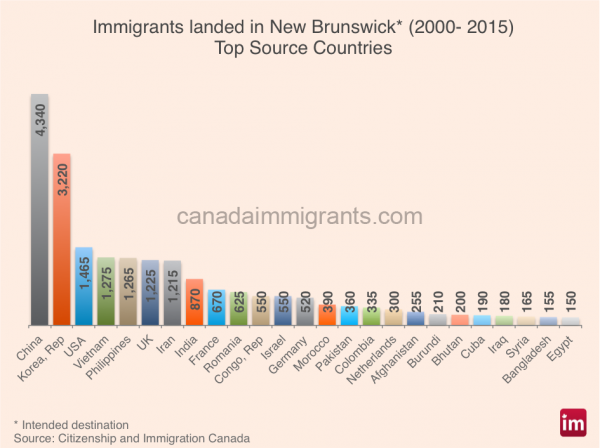
During this period, immigrants to New Brunswick came from more than 110 countries2.
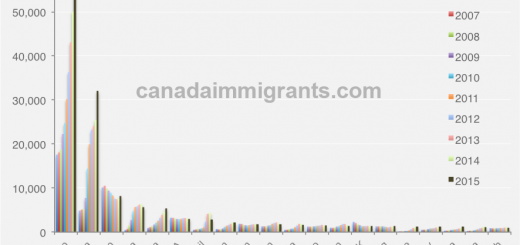
The top ten source countries of newcomers to New Brunswick were China (17%), South Korea (13%), the United States of America (6%), Viet Nam (5%) the Philippines (5%), UK (5%), Iran (5%), India (3%), France (3%) and Romania (2%).
With regard to these source countries, the annual number of immigrants from China and Vietnam showed a clear increasing trend from 2000 to 2014. Then, it declined in 2015. The annual intake from the Philippines increased steadily during this period.
In 2011, according to the National Household Survey, 28,325 foreign-born people3 resided in New Brunswick.
2 Country of Citizenship
3 People born outside Canada
Related articles:

