Call Center Representative Salary in Canada
Call center operator median salary is $27/hr.

The call center industry in Canada remains a significant source of employment in 2025, employing over 200,000 professionals and contributing approximately $15 billion annually to the economy.
Job Opportunities
Availability: There are numerous job openings across Canada, with over 1,500 call center positions listed on platforms like Indeed. Major hubs include Toronto, Montreal, and Vancouver, but remote work opportunities are also prevalent, with around 134 work-from-home call center jobs available.
Roles and Specializations: Call center agents work in various roles, including customer service, technical support, sales, and retention. Specialized roles in industries like financial services, healthcare, and travel are increasingly common, requiring domain-specific knowledge or certifications.
Bilingual Demand: Bilingual agents, particularly those fluent in English and French, are in high demand, especially in Quebec and for companies targeting Franco-American markets. Multilingual skills (e.g., Spanish, Mandarin, Hindi) are also valued due to Canada’s diverse workforce.
In 2025, call centre agents reported higher wages in Nunavut.
| CALL CENTER OPERATOR – SERVICES (NOC 14404) | |||
| 2024 | Wages ($/hour) | ||
| Province/Territory | Low | Median | High |
| Canada | 19 | 27 | 40.38 |
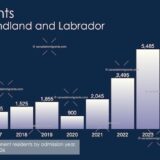
| Newfoundland and Labrador | 19.5 | 26.02 | 39.42 |
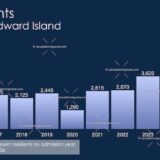
| Prince Edward Island | 16.5 | 23.95 | 33.65 |
| Nova Scotia | 16.15 | 24.5 | 33.65 |
| New Brunswick | 16.5 | 23.95 | 33.65 |
| Quebec | 20 | 25 | 37 |
| Ontario | 20 | 27 | 42 |
| Manitoba | 16 | 22.6 | 35 |
| Saskatchewan | 16.5 | 27 | 49.86 |
| Alberta | 20 | 27 | 46 |
| British Columbia | 19.23 | 30.25 | 40 |
| Yukon Territory | 26.38 | 37.48 | 55.58 |
| Northwest Territories | 28.44 | 35.35 | 46.41 |
| Nunavut | 22.81 | 38.07 | 56.45 |
| Source: Job Bank. 2025 | |||
In 2020, call centre agents reported higher wages in Saskatchewan
| OTHER CUSTOMER AND INFORMATION SERVICES REPRESENTATIVES (NOC 6552) | |||
| 2020 | Wages ($/hour) | ||
| Province/Territory | Low | Median | High |
| Canada | 13 | 18.27 | 29 |
| Newfoundland | 12.15 | 17.5 | 28.72 |
| PEI | 12.85 | 13.5 | 24.75 |
| Nova Scotia | 12.55 | 14.13 | 25 |
| New Brunswick | 12 | 15.33 | 24.62 |
| Quebec | 13.1 | 19.6 | 29.49 |
| Ontario | 14.25 | 17.81 | 28.85 |
| Manitoba | 11.9 | 15.91 | 28.85 |
| Saskatchewan | 13 | 23 | 32.05 |
| Alberta | 15 | 21 | 29.5 |
| British Columbia | 14.6 | 21.15 | 31.25 |
| Yukon Territory | N/A | N/A | N/A |
| NWT | N/A | N/A | N/A |
| Nunavut | N/A | N/A | N/A |
| Source: Job Bank. Dec 2020 | |||
Job Prospects in Canada
| Labour demand and labour supply projections (2019-2021) | |
| Newfoundland and Labrador | Fair |
| Prince Edward Island | Fair |
| Nova Scotia | Fair |
| New Brunswick | Fair |
| Québec | Fair |
| Ontario | Fair |
| Manitoba | Good |
| Saskatchewan | Fair |
| Alberta | Fair |
| British Columbia | Good |
| Yukon | Fair |
| Northwest Territories | Fair |
| Nunavut | Fair |
| Source: Job Bank. Dec 2020 | |
In 2019, call center representatives reported higher wages in Alberta.
| OTHER CUSTOMER AND INFORMATION SERVICES REPRESENTATIVES (NOC 6552) | |||
| 2019 | Wages ($/hr) | ||
| Province/Territory | Low | Median | High |
| Canada | 11.5 | 17 | 28 |
| Newfoundland and Labrador | 11.4 | 16.25 | 27.95 |
| Prince Edward Island | 12.25 | 13 | 23.14 |
| Nova Scotia | 11.55 | 14 | 21.83 |
| New Brunswick | 11.5 | 15 | 23 |
| Quebec | 12.5 | 17.8 | 27.69 |
| Ontario | 14 | 15.91 | 28.13 |
| Saskatchewan | 12 | 19 | 30 |
| Alberta | 15 | 20.67 | 33.85 |
| British Columbia | 13.85 | 19.85 | 30 |
| Yukon Territory | N/A | N/A | N/A |
| Northwest Territories | N/A | N/A | N/A |
| Nunavut | N/A | N/A | N/A |
| Source: Job Bank. May 2019 | |||
In 2017, call center representatives reported higher wages in Alberta.
| Customer and information services representatives (NOC 6552) | |||
| 2017 | Wages ($/hr) | ||
| Province/Territory | Low | Median | High |
| Canada | 11.36 | 17.4 | 28 |
| Alberta | 13.6 | 21.63 | 35 |
| British Columbia | 12.65 | 20 | 30 |
| Saskatchewan | 11.3 | 20.51 | 30 |
| Newfoundland and Labrador | 11 | 16 | 28.69 |
| Ontario | 14 | 16.83 | 27.69 |
| Québec | 12 | 17.58 | 27.18 |
| Prince Edward Island | 11.55 | 12.92 | 27 |
| Manitoba | 11.15 | 15 | 25.71 |
| Nova Scotia | 11 | 14 | 23.8 |
| New Brunswick | 11.25 | 14.8 | 22 |
| Northwest Territories | N/A | N/A | N/A |
| Nunavut | N/A | N/A | N/A |
| Yukon | N/A | N/A | N/A |
| Source: Job Bank. September 2017 | |||
In 2016, the median wage for call center representatives in Canada was $17.25/hr.
| OTHER CUSTOMER AND INFORMATION SERVICES REPRESENTATIVES (NOC 6552-C) | |||
| 2016 | Wages ($/hr) | ||
| Province/Territory | Low | Median | High |
| Canada | 11 | 17.25 | 27.47 |
| Alberta | 12.75 | 21 | 30.77 |
| Yukon | 13.5 | 24.03 | 30.7 |
| Saskatchewan | 11.65 | 20 | 30 |
| Newfoundland & Labrador | 11.4 | 16 | 29 |
| British Columbia | 12 | 19 | 27.83 |
| Ontario | 11.4 | 16.61 | 27.69 |
| Québec | 11.5 | 17.96 | 27 |
| Manitoba | 11 | 16.25 | 25.64 |
| Prince Edward Island | 11.25 | 12.5 | 25.64 |
| Nova Scotia | 11 | 14 | 24 |
| New Brunswick | 11 | 14.5 | 21.63 |
| Northwest Territories | N/A | N/A | N/A |
| Nunavut | N/A | N/A | N/A |
| Source: Job Bank. November 2016* | |||
*Wages are reviewed and updated on the Job Bank Web site on an annual basis.
Licensing
This occupation is not regulated in Canada. This means that you are not required to be registered with one of the provincial or territorial regulatory bodies to be authorized to practise this occupation in Canada.
CALL CENTER REPRESENTATIVE SALARY IN CANADA (2018)
CALL CENTER REPRESENTATIVE SALARY IN CANADA (2017)