Accountant Salary in Canada
In Canada, the median wage for accountants is $38.46/hr.

In 2023, accountants reported higher wages in Alberta.
| ACCOUNTANT (NOC 11100) | |||
| 2023 | Wages ($/hour) | ||
| Province/Territory | Low | Median | High |
| Canada | 23.08 | 38.46 | 64.29 |
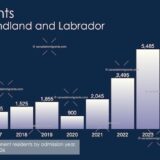
| Newfoundland and Labrador | 20 | 36.25 | 56.56 |
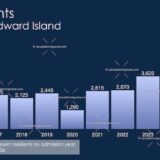
| Prince Edward Island | 26.44 | 38.46 | 59.08 |
| Nova Scotia | 22.8 | 36.06 | 69.74 |
| New Brunswick | 22.26 | 33.33 | 62.98 |
| Quebec | 24.64 | 39.42 | 58.24 |
| Ontario | 23.08 | 39 | 66.67 |
| Manitoba | 21 | 34.62 | 57.95 |
| Saskatchewan | 24.04 | 41.03 | 62.5 |
| Alberta | 24.04 | 41.52 | 72.12 |
| British Columbia | 23.08 | 37.33 | 58 |
| Yukon Territory | N/A | 41.08 | N/A |
| Northwest Territories | N/A | 48.56 | N/A |
| Nunavut | N/A | 67.79 | N/A |
| Source: Job Bank. 2024 | |||
In 2020, financial auditors and accountants reported higher wages in Alberta.
| FINANCIAL AUDITORS AND ACCOUNTANTS (NOC 1111) | |||
| 2020 | Wages ($/hour) | ||
| Province/Territory | Low | Median | High |
| Canada | 20.67 | 35 | 58.17 |
| Newfoundland and Labrador | 19.23 | 31.25 | 48.08 |
| Prince Edward Island | 16.35 | 30.26 | 48.08 |
| Nova Scotia | 21.37 | 35.06 | 53.85 |
| New Brunswick | 19.23 | 30.74 | 52.31 |
| Quebec | 20.51 | 33.65 | 53.96 |
| Ontario | 22.5 | 35.71 | 60.51 |
| Manitoba | 19.99 | 30.53 | 54.4 |
| Saskatchewan | 20.51 | 36.92 | 57.69 |
| Alberta | 22.05 | 41.21 | 67.31 |
| British Columbia | 18.75 | 28.85 | 45.67 |
| Yukon Territory | N/A | N/A | N/A |
| Northwest Territories | 27.43 | 51.37 | 90.98 |
| Nunavut | N/A | N/A | N/A |
| Source: Job Bank. Dec 2020 | |||
Job Prospects in Canada
| Labour demand and labour supply projections (2019-2021) | |
| Newfoundland and Labrador | Fair |
| Prince Edward Island | Fair |
| Nova Scotia | Good |
| New Brunswick | Good |
| Québec | Fair |
| Ontario | Fair |
| Manitoba | Fair |
| Saskatchewan | Fair |
| Alberta | Fair |
| British Columbia | Fair |
| Yukon | Fair |
| Northwest Territories | Good |
| Nunavut | Good |
| Source: Job Bank. Dec 2020 | |
In 2019, financial auditors and accountants reported higher wages in Alberta.
| FINANCIAL AUDITORS AND ACCOUNTANTS (NOC 1111) | |||
| 2019 | Wages ($/hour) | ||
| Province/Territory | Low | Median | High |
| Canada | 19.50 | 33.65 | 57.69 |
| Newfoundland and Labrador | 18.46 | 30.77 | 48.08 |
| Prince Edward Island | 15.87 | 31.79 | 46.15 |
| Nova Scotia | 19.23 | 31.25 | 52.50 |
| New Brunswick | 17.05 | 29.23 | 50.48 |
| Quebec | 19.23 | 32.00 | 53.96 |
| Ontario | 20.19 | 35.00 | 60.00 |
| Manitoba | 18.27 | 30.00 | 52.88 |
| Saskatchewan | 20.19 | 34.62 | 57.69 |
| Alberta | 22.05 | 39.16 | 61.44 |
| British Columbia | 18.27 | 30.00 | 48.57 |
| Yukon Territory | N/A | N/A | N/A |
| Northwest Territories | 27.43 | 51.37 | 90.98 |
| Nunavut | N/A | N/A | N/A |
| Source: Job Bank. November, 2019 | |||
In 2017, financial auditors and accountants reported higher wages in the Northwest Territories.
| FINANCIAL AUDITORS AND ACCOUNTANTS (NOC 1111-A) | |||
| 2017 | Wages ($/hr) | ||
| Province/Territory | Low | Median | High |
| Canada | 18 | 31.79 | 55.29 |
| Northwest Territories | 17.65 | 42.29 | 71.82 |
| Alberta | 21.21 | 36.06 | 59.86 |
| Ontario | 18 | 35.9 | 58.23 |
| Manitoba | 16.83 | 28.85 | 53.85 |
| Saskatchewan | 20 | 33.33 | 53.84 |
| Newfoundland and Labrador | 19.23 | 30.77 | 50.48 |
| Nova Scotia | 17.95 | 28.85 | 48.08 |
| Québec | 18 | 28.72 | 48.08 |
| British Columbia | 17 | 27.88 | 47 |
| Prince Edward Island | 17 | 26 | 43.59 |
| New Brunswick | 16.7 | 27.4 | 42.56 |
| Nunavut | N/A | N/A | N/A |
| Yukon | N/A | N/A | N/A |
| Source: Job Bank. September 2017* | |||
*Wages are reviewed and updated on the Job Bank Web site on an annual basis.
In 2016, the median wage for accountants in Canada was $31.25/hr.
Salaries for accountants vary by province. For example, in 2016, accountants in the Northwest Territories had the highest wages.
| FINANCIAL AUDITORS AND ACCOUNTANTS (NOC 1111-A) | |||
| 2016 |
Wages ($/hr) |
||
| Province/Territory | Low | Median | High |
| Canada | 18 | 31.25 | 53.85 |
| Northwest Territories | 17.65 | 42.29 | 71.82 |
| Ontario | 17.79 | 34.36 | 57.69 |
| Alberta | 20.51 | 34.26 | 56.25 |
| Saskatchewan | 20.51 | 35 | 52.88 |
| Newfoundland and Labrador | 17.09 | 28.85 | 51.44 |
| Manitoba | 16.83 | 28.85 | 50 |
| Québec | 18.75 | 28.85 | 50 |
| Yukon | 12.39 | 28.64 | 49.79 |
| Nova Scotia | 17.94 | 26.44 | 48.72 |
| British Columbia | 16.64 | 27.69 | 46.67 |
| New Brunswick | 13.75 | 27.47 | 42.56 |
| Prince Edward Island | 17 | 27.69 | 42.56 |
| Nunavut | N/A | N/A | N/A |
| Source: Job Bank. November 2016* | |||
*Wages are reviewed and updated on the Job Bank Web site on an annual basis.
Licensing
Registration with a regulatory body is required in all provinces and territories for this occupation.
ACCOUNTANT SALARY IN CANADA 2017
ACCOUNTANT SALARY IN CANADA 2016