Ontario Immigration by Country (2015)

From 2000 to 2015, 3,993,035 permanent residents landed in Canada.
During this period, Ontario was the province of choice of nearly half of Canada’s immigrants who came from over 200 countries**.
| Annual immigration to Ontario* | ||
| Year | Total | Percentage*** |
| 2000 | 133,520 | 58.7% |
| 2001 | 148,650 | 59.3% |
| 2002 | 133,620 | 58.3% |
| 2003 | 119,755 | 54.1% |
| 2004 | 125,105 | 53.0% |
| 2005 | 140,530 | 53.6% |
| 2006 | 125,895 | 50.0% |
| 2007 | 111,320 | 47.0% |
| 2008 | 110,880 | 44.8% |
| 2009 | 106,875 | 42.4% |
| 2010 | 118,125 | 42.1% |
| 2011 | 99,465 | 40.0% |
| 2012 | 99,125 | 38.4% |
| 2013 | 103,570 | 40.0% |
| 2014 | 95,770 | 36.8% |
| 2015 | 103,620 | 38.1% |
| Total | 1,875,825 | 47.0% |
| *Intended Destination | ||
| ***Ontario’s share of Canada’s immigration | ||
| Source: Government of Canada | ||
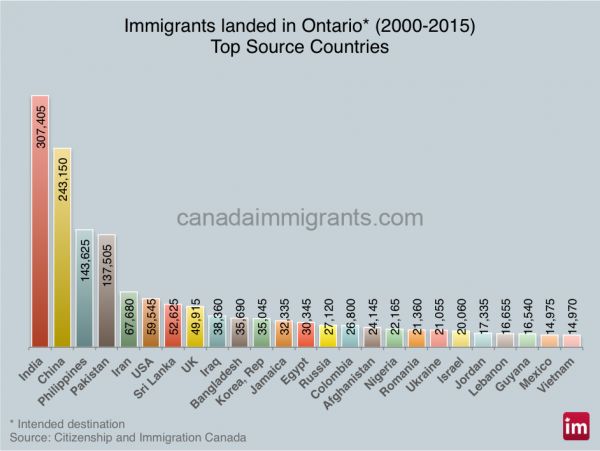
From 2000 to 2015, newcomers came from more than 185 countries, and the top ten source countries were India (16.4%), China (13%), the Philippines (7.7%), Pakistan (7.3%), Iran (3.6%), the United States of America (3.2%), Sri Lanka (2.8%), UK (2.7%), Iraq (2%) and Bangladesh (1.9%).
In regards to these source countries, the annual number of immigrants from China and Pakistan showed a decreasing trend while the inflow from the Philippines experienced a remarkable growth, and the inflow from the other seven countries remained about the same during this period.
According to the National Household Survey, about 53% of the foreign-born population**** resided in Ontario (3,610,460) in 2011.
**Country of citizenship
****Born outside Canada
Related articles:


