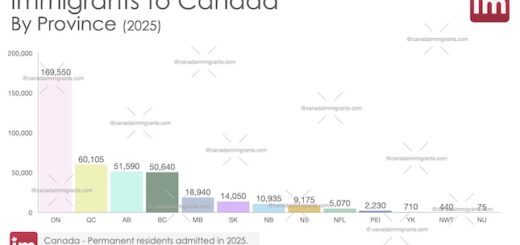
Immigration to Canada by Province – 2025
In 2025, a total of 393,530 foreign citizens were admitted to Canada as permanent residents.

Canada immigration statistics. Charts and tables on Canada’s immigrants and economic outcomes.
The material on this website is protected by international copyright and trademark law.
In 2025, a total of 393,530 foreign citizens were admitted to Canada as permanent residents.
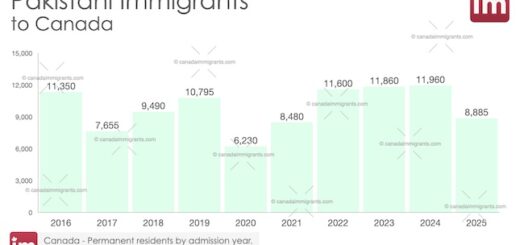
In 2025, 8,885 Pakistanis were admitted to Canada as permanent residents.
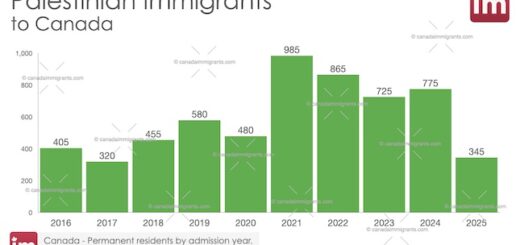
In 2025, 345 Palestinians were admitted to Canada as permanent residents.
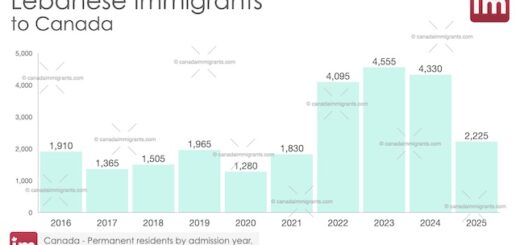
In 2025, 2,225 Lebanese were admitted to Canada as permanent residents.
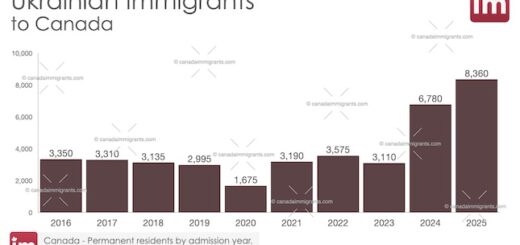
In 2025, 8,360 Ukrainians were admitted to Canada as permanent residents.
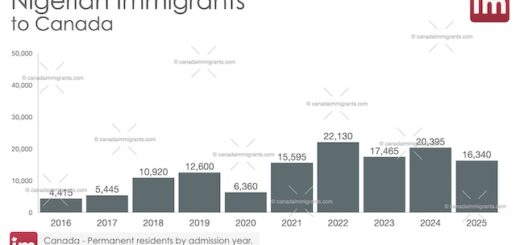
In 2025, 16,340 Nigerians were admitted to Canada as permanent residents.
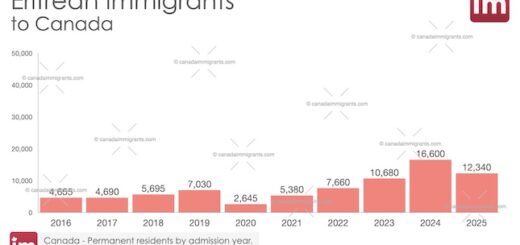
In 2025, 12,340 Eritreans were admitted to Canada as permanent residents.
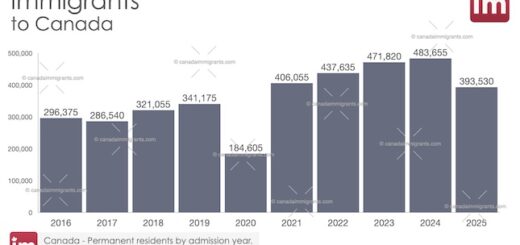
Permanent resident admissions decreased from 483,655 in 2024 to 393,530 in 2025