Average House Price in Vancouver
The average house price in Vancouver is $1,114,800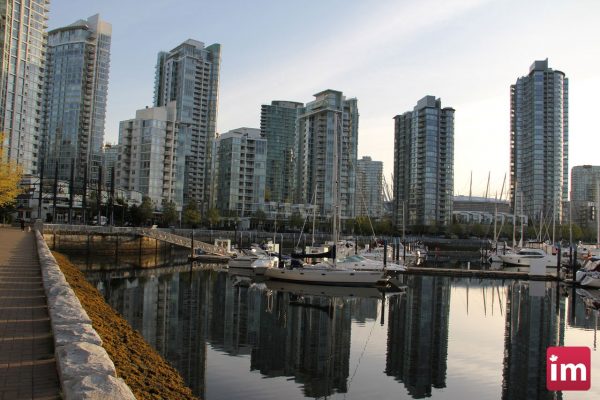
The average home price was down by 4.5% year-over-year.
| Average House Price in Vancouver | |||
| 2023 | 2024 | 2025 | |
| January | $1,114,800* | $1,166,800* | $1,173,000 |
| February | $1,132,600* | $1,182,000* | $1,185,100 |
| March | $1,145,700* | $1,198,400* | $1,190,900 |
| April | $1,173,000* | $1,206,500* | $1,184,600 |
| May | $1,188,000 | $1,212,000 | $1,177,100 |
| June | $1,269,399* | $1,207,100* | $1,173,100 |
| July | $1,274,782* | $1,197,700* | $1,165,300 |
| August | $1,208,400 | $1,195,900 | $1,150,400 |
| September | $1,203,300 | $1,179,700 | $1,142,100 |
| October | $1,196,500 | $1,172,200* | $1,132,500 |
| November | $1,185,100 | $1,169,300* | $1,123,700 |
| December | $1,168,700 | $1,166,900* | $1,114,800 |
| Source: CREA | |||
| *Updated | |||
Housing Market in Vancouver – December 2025
In December 2025, Vancouver’s housing market wrapped up a dismal year with subdued activity, as residential sales in Metro Vancouver totaled just 1,537 units—a 12.9% drop from December 2024 and 20.7% below the 10-year seasonal average. This sluggishness contributed to the region’s lowest annual sales total in over two decades (23,800 homes sold in 2025, down 10.4% year-over-year), amid high inventory, cautious buyers facing lingering affordability challenges, and economic uncertainties. Benchmark prices continued their downward slide across property types: detached homes fell to $1,879,800 (down 5.3% from December 2024 and 1.1% month-over-month), apartments to $710,000 (also down 5.3% annually), and townhouses to $1,056,600 (down 5% yearly). With plentiful listings and a sales-to-active ratio around 12.7% signaling buyer leverage, the market tilted firmly toward purchasers, who enjoyed more negotiating power and options as sellers made end-of-year concessions to close deals.
Housing Market in Vancouver – November 2025
In November 2025, Vancouver’s housing market continued its cooling trend amid slower sales and rising inventory, with the Metro Vancouver composite benchmark price dipping to $1,123,700—a modest 0.3% decline from October and a more noticeable 3.9% drop year-over-year. Detached homes felt the pinch hardest at a $1,900,600 benchmark (down 4.3% annually), while apartments sat at $714,300 (down 5.2% YoY) and townhouses at $1,065,600 (down 4.4% YoY). Sales plummeted 15.4% from November 2024 to just 1,846 units, pushing the sales-to-active listings ratio to a buyer-friendly 12.6%, with over 15,000 properties lingering on the market. This softening, tied to the ongoing exodus of temporary residents and policy shifts curbing population growth, has finally started easing the insane pressure on prices—though Vancouver remains Canada’s priciest market by a mile.
Housing Market in Vancouver – October 2025
In October 2025, Vancouver’s housing market remained in a balanced yet sluggish state, favoring buyers amid elevated inventory and softer demand, with the benchmark price for all residential properties in Metro Vancouver dipping to $1,132,500—a 3.4% decline from the previous year and 0.8% from September—while the average sale price hovered around $1,265,670.
Home sales totaled 2,255 units, marking a 20% monthly increase but a 14% drop year-over-year, including 693 detached homes at an average of $2,096,078 (up 1.6% annually but down 1.5% monthly), 1,071 apartments, and 477 attached homes averaging $1,183,985 (down 8% yearly).
Active listings surged 13.2% to 16,393, yielding a sales-to-active-listings ratio of 13.8% and a sales-to-new-listings ratio of 41%, signaling equilibrium but prolonged stagnation after over three years of subdued activity.
Detached benchmark prices fell 4.3% annually to $1,916,400, reflecting “more realistic pricing strategies” and negotiating leverage for purchasers, though provincial trends showed modest 0.8% average price growth to $978,658 amid Bank of Canada rate cuts boosting late-month momentum.
Overall, the market’s buyer-friendly tilt persisted into fall, with experts anticipating stabilization and slight price recovery in 2026 driven by immigration and affordability gains, underscoring Vancouver’s enduring status as Canada’s priciest urban center.
Housing Market in Vancouver – September 2025
In September 2025, Vancouver’s real estate market continued to favor buyers amid easing prices and abundant inventory, with the Greater Vancouver REALTORS® reporting 1,875 residential sales—a modest 1.2% increase from September 2024 but 20.1% below the 10-year seasonal average—driven by the Bank of Canada’s recent policy rate cut and improved affordability.
The MLS® Home Price Index composite benchmark price for all residential properties dipped 3.2% year-over-year to $1,142,100, reflecting declines across segments like condos (down 4.4% to $728,800) and detached homes (down 2.9% to $2,127,020), while new listings surged 6.2% to 6,527 and active inventory climbed 14.4% to 17,079 properties, pushing the sales-to-active listings ratio to a buyer-friendly 11.3%.
Overall, the market showed signs of stabilization with heightened buyer optimism for further rate reductions by year-end, though persistent affordability challenges and elevated supply tempered rapid recovery, positioning suburbs like Burnaby and Langley as hotspots for negotiation opportunities heading into fall.
Housing Market in Vancouver – August 2025
In August 2025, the Vancouver housing market showed signs of modest recovery from a sluggish first half of the year, with home sales on the Multiple Listing Service (MLS) reaching 1,959 units, marking a 2.9% increase from August 2024, including 575 detached homes, 956 apartments, and 409 attached homes, though still 19.2% below the 10-year seasonal average. The market remained balanced, as indicated by a sales-to-new-listings ratio (SNLR) of 46%, up from 35% and 41% in prior months, with 4,225 new listings—a 2.8% rise year-over-year—and total active listings surging 18% to 16,242, giving buyers more options amid easing prices. The benchmark price for all residential properties dipped 3.8% annually to $1,150,400 and 1.3% monthly, while the average home price stood at $1,226,351, down 1.9% year-over-year; detached homes averaged $1,927,418 (down 7.9% annually), attached homes $1,217,670 (up 0.4% annually), and apartments saw softer demand overall. This uptick in activity was attributed to softer prices drawing buyers back, though broader economic pressures like high interest rates, affordability challenges, and trade tensions continued to temper enthusiasm, with forecasts suggesting a continued cooling and potential 2-10% price declines through the year
Housing Market in Vancouver – July 2025
In July 2025, Metro Vancouver’s housing market continued to show signs of stabilization, transitioning into a buyer-driven environment with a composite benchmark price of $1,165,300, down 2.7% year-over-year and 0.7% from June 2025. Residential sales totaled 2,286, a 2% decrease from July 2024 but a 4.8% increase from June, indicating early recovery despite being 13.9% below the 10-year seasonal average. Inventory levels remained high at 17,168 active listings, up 19.8% year-over-year, with 5,642 new listings added, fostering a balanced market with a sales-to-active listings ratio of 13.8%. Detached home sales dropped 4.1% to 660, apartments fell 2.9% to 1,158, while attached home sales rose 5% to 459, with benchmark prices for detached homes at $1,974,400 (-3.6% YoY), apartments at $743,700 (-3.2% YoY), and townhouses at $1,099,200 (-2.3% YoY), reflecting cautious buyer sentiment amid economic uncertainty and high inventory.
Housing Market in Vancouver – June 2025
In June 2025, Metro Vancouver’s housing market showed signs of stabilization after a turbulent first half of the year, with residential sales totaling 2,181, a 9.8% decrease from 2,418 in June 2024, and 25.8% below the 10-year seasonal average of 2,940. New listings rose 10.3% year-over-year to 6,315, pushing active listings to 17,561, a 23.8% increase from June 2024 and 43.7% above the 10-year average, creating a buyer’s market with an 8前行. The sales-to-active listings ratio was 12.8%, indicating balanced conditions, with detached homes at 9.9%, townhomes at 16.9%, and apartments at 13.9%. The MLS® Home Price Index composite benchmark price was $1,173,100, down 2.8% from June 2024, with detached homes at $1,994,500, townhomes at $1,103,900, and apartments at $748,400, reflecting slight downward pressure amid high inventory and lower mortgage rates
Housing Market in Vancouver – May 2025
In May 2025, Vancouver’s housing market remained firmly in buyer’s territory, characterized by a sales-to-new-listings ratio (SNLR) of 34%, with 2,228 homes sold, an 18% year-over-year decline, and active listings reaching 17,094, the highest since 2016. The average home price in Greater Vancouver was $1,266,441, down 5.9% from May 2024, while the benchmark price fell 2.9% to $1,177,100. Detached homes averaged $2,046,719, attached homes $1,257,813, and apartments $801,280, reflecting varied price trends with detached homes dropping 8% annually, attached homes slightly up, and apartments down 3.6%. High inventory, economic uncertainty from U.S. tariff threats, and cautious buyer sentiment due to affordability challenges continued to suppress demand despite lower interest rates following Bank of Canada cuts totaling 2.25% since June 2024.
Housing Market in Vancouver – April 2025
In April 2025, Vancouver’s housing market continued to cool, reflecting a broader trend of declining prices and reduced sales activity. The MLS® Home Price Index composite benchmark price for all residential properties in Metro Vancouver was $1,184,500, marking a 1.8% decrease year-over-year and a 0.5% drop from March 2025. Apartment benchmark prices fell to $762,800, down 2% from April 2024, while single-family homes averaged $2,029,400, a significant 8.2% decline from the previous year. This softening was driven by a 23.6% drop in home sales compared to April 2024, with 2,163 transactions recorded, alongside a 27.7% increase in active listings, signaling a shift toward a buyer’s market amid economic uncertainty.
Housing Market in Vancouver – March 2025Vancouver’s housing market in March 2025 is firmly in buyer’s market territory. , with the benchmark price at $1,190,900, a 0.6% annual decrease. Sales fell 11.7% year-over-year, and housing starts dropped 59% from March 2024, primarily due to reduced multi-unit construction. Rental prices declined 5.7% to $2,822, the lowest in nearly three years, reflecting high supply from apartment completions, though demand for larger units persists.
House prices in Vancouver 2020-2022
| Average House Price in Vancouver | |||
| 2020 | 2021 | 2022 | |
| January | $1,001,700* | $1,059,200* | $1,190,000* |
| February | $1,014,600* | $1,087,700* | $1,237,800* |
| March | $1,027,200* | $1,127,200* | $1,263,500* |
| April | $1,028,800* | $1,155,700* | $1,264,700* |
| May | $1,028,400 | $1,099,100* | $1,257,700* |
| June | $1,026,200* | $1,099,300* | $1,233,000* |
| July | $1,032,600* | $1,095,000* | $1,205,000* |
| August | $1,039,100* | $1,099,400* | $1,178,700* |
| September | $1,042,100* | $1,112,000* | $1,153,000* |
| October | $1,045,900* | $1,125,200* | $1,146,400* |
| November | $1,044,400* | $1,138,400* | $1,129,300* |
| December | $1,048,600* | $1,152,500* | $1,112,600* |
| Source: CREA | |||
| *Updated | |||
Home prices depend on the size, location, amenities, the age and condition of the apartment, townhouse or house.
| Average House Price in Vancouver | |||
| 2017 | 2018 | 2019 | |
| January | $905,800* | $1,067,900* | $1,021,000* |
| February | $916,900* | $1,082,600* | $1,017,900* |
| March | $933,300* | $1,095,000* | $1,012,500* |
| April | $955,500 | $1,102,300* | $1,010,200* |
| May | $981,100* | $1,104,400* | $999,800* |
| June | $998,700* | $1,004,400* | $991,000* |
| July | $1,019,400* | $1,098,600* | $987,200* |
| August | $1,040,500* | $1,083,200* | $986,400* |
| September | $1,047,500* | $1,068,600* | $984,200* |
| October | $1,051,300* | $1,061,300* | $986,400* |
| November | $1,056,300* | $1,041,700* | $986,800* |
| December | $1,061,000* | $1,033,300* | $993,300* |
| Source: CREA | |||
| *Updated | |||
Check if you are financially ready to own a home. Decide if homeownership is right for you.
Here are some recommendations from the Canada Mortgage and Housing Corporation to buying your first home:
- Analyze your situation and mortgage possibilities
- Find the right home
- Make and offer and close the deal


