Immigrants in Vancouver

In 2011, the Census Metropolitan Area of Vancouver was home to the second largest immigrant population in Canada
In 2011, a total of 913,310 immigrants accounted for 40% of Vancouver’s population, and they represented 21% of British Columbia’s population
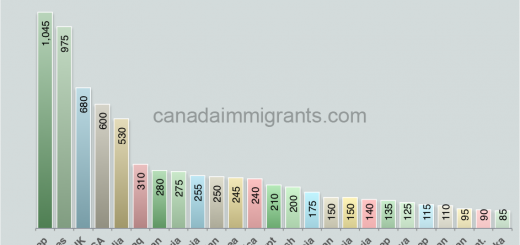
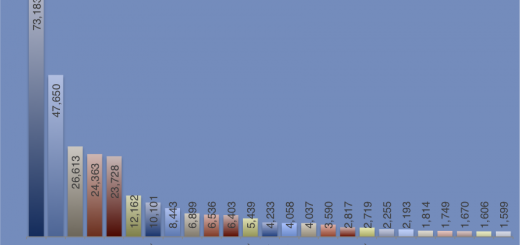
In 2011, Chinese, Indian and Filipino were the largest immigrant groups in Vancouver. Other top source countries of immigration were Hong Kong, United Kingdom, Taiwan, South Korea, Iran, United States and Viet Nam. All together represented 71% of the immigrant population in Vancouver.
Fiji, Germany, Italy, Japan, Poland, South Africa, Pakistan, Malaysia, Netherlands and the Russian Federation were also in the top 20 sources of immigration to Vancouver.
In Vancouver, the immigrant population grew 24% from 738,550 in 2001 to 913,310 in 2011
From 2001 to 2011, in Vancouver CMA, immigrants from the countries (listed above) experienced the highest increases: the Philippines (90%), South Korea (66%), India (64%) and Iran (62%). In contrast, the highest decreases were observed among immigrants from Hong Kong (-16%), United Kingdom (-11%) and Taiwan (-7%).
Note:
We would like to point out that we used data from the National Household Survey (NHS) knowing that its quality is still under criticism because this survey was conducted on a voluntary basis, so its validity, reliability and comparability with other instruments, such as population censuses, have become an issue. In fact, before the first release of the NHS results, Statistics Canada issued warnings and cautions when using the NHS data, so use this data cautiously.
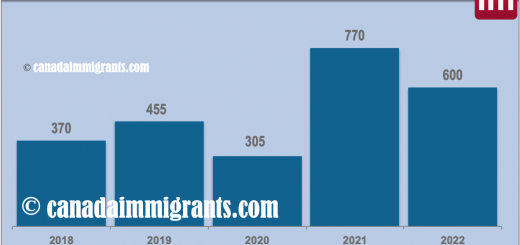
From 2005 to 2015, Vancouver was the destination of choice for 362,909 new permanent residents.
| Landing Year | Total |
| 2005 | 39,499 |
| 2006 | 36,299 |
| 2007 | 32,956 |
| 2008 | 37,466 |
| 2009 | 34,626 |
| 2010 | 37,339 |
| 2011 | 28,969 |
| 2012 | 29,492 |
| 2013 | 29,509 |
| 2014 | 28,395 |
| 2015 | 28,359 |
| 2005-2015 | 362,909 |
| Source: Government of Canada | |