Immigration to Newfoundland and Labrador (2016)
Newfoundland attracts very few immigrants
Immigration to Newfoundland and Labrador
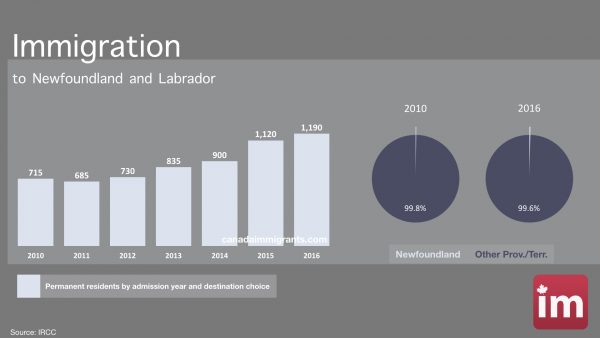
From 2010 to 2016, Canada admitted 1,874,740 new immigrants (permanent residents), and Newfoundland and Labrador was the destination choice of 6,175 new immigrants. During this period, immigration to Newfoundland increased from 715 in 2010 to 1,190 in 2016 –representing 0.25% and 0.4% of Canada’s immigration respectively.
Newfoundland: Immigration by class
| Immigration to Newfoundland by class and landing year | |||||||
| Immigration Class | 2010 | 2011 | 2012 | 2013 | 2014 | 2015 | 2016 |
| Skilled Worker | 175 | 105 | 115 | 95 | 105 | 100 | 115 |
| Canadian Experience | — | — | 25 | 15 | 30 | 25 | 40 |
| Live-in Caregivers | 10 | — | — | 10 | 15 | 15 | 30 |
| Provincial Nominee | 215 | 275 | 365 | 440 | 455 | 530 | 455 |
| Family | 120 | 130 | 115 | 150 | 120 | 140 | 195 |
| Refugees | 160 | 145 | 100 | 130 | 165 | 295 | 335 |
| Other | 35 | 30 | 10 | 0 | 10 | 15 | 20 |
| TOTAL | 715 | 685 | 730 | 835 | 900 | 1,120 | 1,190 |
| Source: IRCC | |||||||
From 2010 to 2016, provincial nominees and refugees were the largest groups of permanent residents in Newfoundland, followed by family class and skilled workers.
IMMIGRATION TO NEWFOUNDLAND – ANIMATED CHARTS

