Montreal CMA Population 2016 – Montreal, Laval, Longueuil, Terrebonne

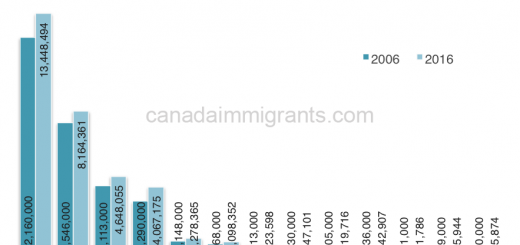
According to the 2016 Census, Canada’s population reached 35,151,728 –an increase of 3,538,738 people over 2006.
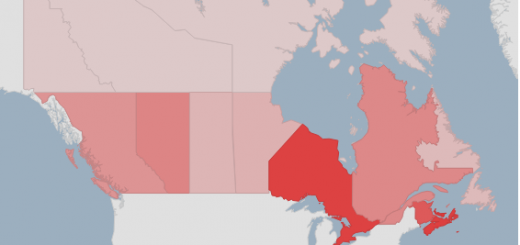
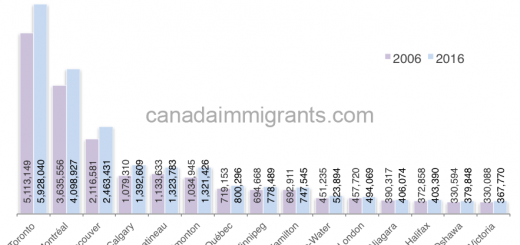
In 2016, 4,098,927 or 11.7% of Canada’s population resided in the Montreal Census Metropolitan Area (CMA).
In 2016, the Montreal CMA was composed by the following 93 subdivisions:
| Montreal: CMA Subdivisions | |||
| Subdivision | 2006 | 2016 | Annual Growth (%) |
| Montréal V | 1,620,693 | 1,704,694 | 0.5% |
| Laval | 368,709 | 422,993 | 1.5% |
| Longueuil | 229,330 | 239,700 | 0.5% |
| Terrebonne | 94,703 | 111,575 | 1.8% |
| St-Jean-sur-Rich | NA | 95,114 | |
| Brossard | 71,154 | 85,721 | 2.0% |
| Repentigny | 76,237 | 84,285 | 1.1% |
| Saint-Jérôme | 63,729 | 74,346 | 1.7% |
| Blainville | 46,493 | 56,863 | 2.2% |
| Mirabel | 34,626 | 50,513 | 4.6% |
| Dollard abalone | 48,930 | 48,899 | 0.0% |
| Chateauguay | 42,786 | 47,906 | 1.2% |
| Mascouche | 33,764 | 46,692 | 3.8% |
| Saint-Eustache | 42077 | 44,008 | 0.5% |
| Boucherville | 39,062 | 41,671 | 0.7% |
| Vaudreuil-Dorion | 25,789 | 38,117 | 4.8% |
| Cote Saint-Luc | 31,395 | 32,448 | 0.3% |
| Pointe-Claire | 30,161 | 31,380 | 0.4% |
| Sainte-Julie | 29,079 | 29,881 | 0.3% |
| Chambly | 22,608 | 29,120 | 2.9% |
| Saint-Constant | 23,957 | 27,359 | 1.4% |
| Boisbriand | 26468 | 26,884 | 0.2% |
| Saint-Bruno-de-Montarville | 24,388 | 26,394 | 0.8% |
| Sainte-Thérèse | 25,224 | 25,989 | 0.3% |
| The Prairie | 21,763 | 24,110 | 1.1% |
| Beloeil | 18,927 | 22,458 | 1.9% |
| The Assumption | 16723 | 22,429 | 3.4% |
| Saint-Lambert | 21,599 | 21,861 | 0.1% |
| Varennes | 20,950 | 21,257 | 0.1% |
| Candiac | 15,947 | 21,047 | 3.2% |
| Saint-Lin–LaurentidesCensus subdivision – Saint-Lin–Laurentides, Ville | NA | 20,786 | |
| Westmount | 20,494 | 20,312 | -0.1% |
| Mont Royal | 18,933 | 20,276 | 0.7% |
| Kirkland | 20,491 | 20,151 | -0.2% |
| Saint Lazare | 17,016 | 19,889 | 1.7% |
| Beaconsfield | 19,194 | 19,324 | 0.1% |
| Dorval | 18,088 | 18,980 | 0.5% |
| Mont-Saint-Hilaire | 15,720 | 18,585 | 1.8% |
| Sainte-Marthe-sur-le-Lac | 11,311 | 18,074 | 6.0% |
| Two-Mountains | 17,402 | 17,496 | 0.1% |
| Saint-Basile-le-Grand | 15,605 | 17,059 | 0.9% |
| Saint Catherine | 16,211 | 17,047 | 0.5% |
| Saint-Colomban | 10,136 | 16,019 | 5.8% |
| Pincourt | 11,197 | 14,558 | 3.0% |
| Sainte-Anne-des-Plaines | 13,001 | 14,421 | 1.1% |
| Rosemère | 14,173 | 13,958 | -0.2% |
| Lavaltrie | 12,120 | 13,657 | 1.3% |
| Mercier | 10,121 | 13,115 | 3.0% |
| Beauharnois | 11,918 | 12,884 | 0.8% |
| Saint-Amable | 8398 | 12,167 | 4.5% |
| The Island of Perrot | 9,927 | 10,756 | 0.8% |
| Notre-Dame-de-l’Île-Perrot | 9,885 | 10,654 | 0.8% |
| Bois-des-Filion | 8,383 | 9,636 | 1.5% |
| Carignan | 7426 | 9,462 | 2.7% |
| Lorraine | 9613 | 9,352 | -0.3% |
| Otterburn Park | 8464 | 8,421 | -0.1% |
| Saint-Zotique | 5,251 | 7,934 | 5.1% |
| Delson | 7,322 | 7,457 | 0.2% |
| Coteau-du-Lac | 6346 | 7,044 | 1.1% |
| Hampstead | 6,996 | 6,973 | 0.0% |
| The Cedars | 5,732 | 6,777 | 1.8% |
| Saint-Joseph-du-Lac | 4,958 | 6,687 | 3.5% |
| Pointe-Calumet | 6574 | 6,428 | -0.2% |
| Saint-Philippe | 5,121 | 6,320 | 2.3% |
| Charlemagne | 5594 | 5,913 | 0.6% |
| Verchères | 5,243 | 5,835 | 1.1% |
| McMasterville | 5,234 | 5,698 | 0.9% |
| The Epiphany | 4,606 | 5,493 | 1.9% |
| The Coteaux | 3,764 | 5,368 | 4.3% |
| Richelieu | 5,208 | 5,236 | 0.1% |
| Hudson | 5,088 | 5,185 | 0.2% |
| Montreal-West | 5184 | 5,050 | -0.3% |
| Sainte-Anne-de-Bellevue | 5,197 | 4,958 | -0.5% |
| Saint-Mathias-sur-Richelieu | 4,506 | 4,531 | 0.1% |
| Montreal-East | 3,822 | 3,850 | 0.1% |
| Oka | 3,300 | 3,824 | 1.6% |
| Baie-D’Urfé | 3,902 | 3,823 | -0.2% |
| Saint Sulpice | 3,332 | 3,439 | 0.3% |
| The Epiphany | 3,129 | 3,200 | 0.2% |
| Saint-Mathieu-de-Beloeil | 2,288 | 2,619 | 1.4% |
| Saint-Isidore | 2,489 | 2,608 | 0.5% |
| Léry | 2,385 | 2,318 | -0.3% |
| Saint-Mathieu | 1,894 | 2,156 | 1.4% |
| Terrace-Vaudreuil | 1,985 | 1,986 | 0.0% |
| Gore | 1,540 | 1,904 | 2.4% |
| Saint-Placide | 1,642 | 1,686 | 0.3% |
| Pointe-des-Cascades Hotels | 1046 | 1,481 | 4.2% |
| Vaudreuil-sur-le-Lac | 1,290 | 1,341 | 0.4% |
| Senneville | 962 | 921 | -0.4% |
| The Ile-Cadieux | 128 | 126 | -0.2% |
| The Dorval Island | 0 | 5 | |
| Kanesatake ¶ | ¶ | incompletely enumerated | |
| Kahnawake ¶ | ¶ | incompletely enumerated | |
| TOTAL | 3,635,556 | 4,098,927 | 1.3% |
| Source: Statistics Canada | |||
In 2016, more than 50% of the Montreal CMA population resided in two subdivisions: Montreal Ville (42%) and Laval (10%).
Over the last decade, Montreal (CMA) population increased 1.3% per year, and the subdivisions that registered the highest annual population growth were Sainte-Marthe-sur-le-Lac (6%), Saint-Colomban (5.8%), Saint-Zotique (5.1%), Vaudreuil-Dorion (4.8%) and Mirabel (4.6%).