Canada Immigrants by Metropolitan Area (2016)
In 2016, Canada admitted 296,340 immigrants
In 2016, Canada admitted 296,340 new permanent residents (9% increase from the previous year).
In 2016, five in ten new immigrants chose Toronto, Montreal and Vancouver as their destination in Canada.
About eight in ten new immigrants chose the top ten Census Metro Areas (CMAs) shown in the map above.
Among the top ten metro areas, Halifax registered the highest percentage increase of new immigrants (67%) from 2,735 in 2015 to 4,570, followed by Saskatoon (29.2%) from 4,450 in 2015 to 5,750 in 2016, and Ottawa-Gatineau (28.8%) from 7,170 in 2015 to 9,235 in 2016.
| Permanent Residents admitted in 2016 -Top Metro Areas | ||
| Total | Percentage | |
| Toronto | 81,370 | 27% |
| Montréal | 41,645 | 14% |
| Vancouver | 29,710 | 10% |
| Calgary | 21,430 | 7% |
| Edmonton | 17,885 | 6% |
| Winnipeg | 14,065 | 5% |
| Ottawa – Gatineau | 9,235 | 3% |
| Saskatoon | 5,750 | 2% |
| Regina | 4,995 | 2% |
| Halifax | 4,570 | 2% |
| Hamilton | 4,190 | 1% |
| Kitchener-Cambridge- Waterloo | 3,730 | 1% |
| Québec | 3,515 | 1% |
| London | 3,305 | 1% |
| Trois-Rivières | 2,890 | 1% |
| Windsor | 2,305 | 1% |
| Victoria | 2,115 | 1% |
| Charlottetown | 2,095 | 1% |
| Fredericton | 1,490 | 1% |
| Sherbrooke | 1,450 | 0% |
| Moncton | 1,390 | 0% |
| Wood Buffalo | 1,305 | 0% |
| Saint John | 1,235 | 0% |
| Abbotsford – Mission | 1,130 | 0% |
| Red Deer | 1,105 | 0% |
| Subtotal | 263,905 | 89% |
| Other | 32,435 | 11% |
| TOTAL | 296,340 | 100% |
| Source: IRCC 2017 | ||
Related articles:
Canada Immigrants by Province – 2016
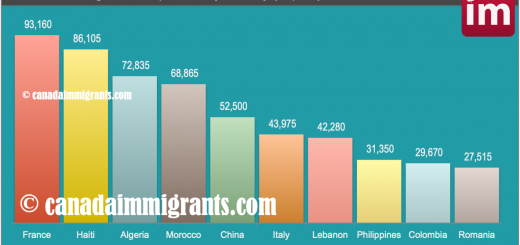
Canada Immigrants by Source Country – 2016